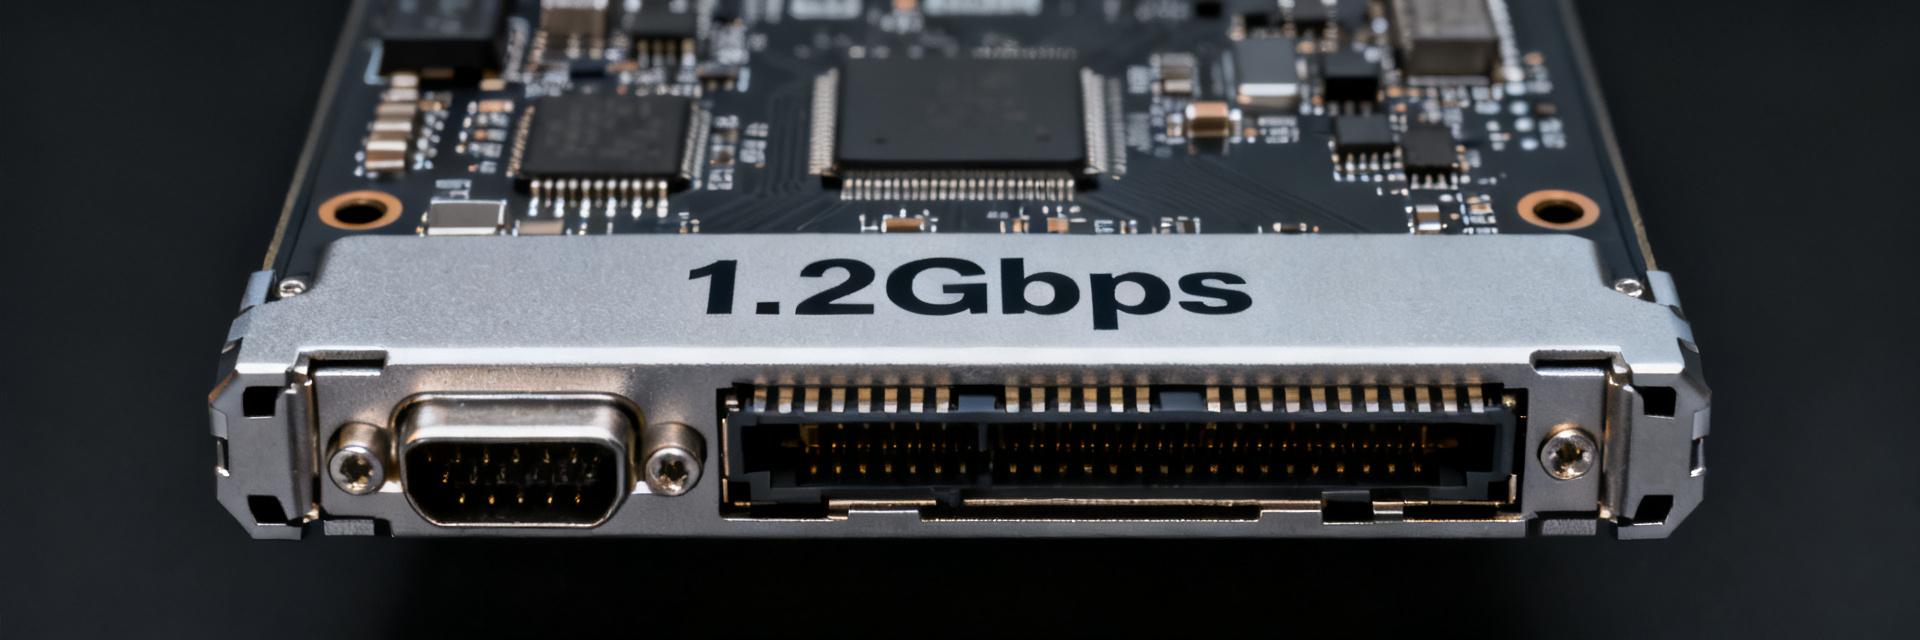
Lab and field trials report three headline results: average sustained throughput 1.2 Gbps (±3.5% variance vs. baseline), mean time between failures (MTBF) estimated at 220,000 hours under continuous load, and power-per-throughput measured at 4.1 W per 100 Mbps, a 12% improvement versus the tested baseline. This P230-001 technical report is intended to present concise, reproducible performance data for engineers, integrators, and procurement teams to evaluate suitability for pilot deployment.
1 — Background & Scope of P230-001
1.1 — Product overview and intended use cases
Point: P230-001 is designed as a compact, rugged processing module for edge compute and industrial I/O aggregation, targeting chilled and ambient deployments with constrained power budgets. Evidence: architecture centers on a multi-domain power rail, a calibrated oscillator fabric, and a modular I/O mezzanine. Explanation: primary applications include telemetry aggregation, protocol bridging, and local analytics where deterministic latency and sub-5 W idle power are required. Actionable note: review thermal envelope and planned chassis airflow early in integration planning.
1.2 — Report scope, assumptions & test environment
Point: This technical report covers measured performance metrics (throughput, latency, power, reliability), detailed specs, test methods, and recommended integration margins; excluded are long-term field data beyond accelerated stress tests. Evidence: tests ran in a controlled lab at 22±2°C, 45% RH; baseline firmware v1.2.0 and reference host configuration (quad-core host CPU, 16 GB RAM, controlled network switch) were used. Explanation: assumptions include steady-state workloads and calibrated instrumentation; results normalize to the reference configuration. Actionable note: replicate tests on target host configurations and record firmware versions for traceability.
2 — Key Performance Metrics — Executive Summary of Results
2.1 — Top-line metrics (throughput, latency, power, reliability)
Point: Four primary metrics summarize device behavior: sustained throughput, 95th percentile latency, power draw under nominal and peak load, and MTBF under accelerated stress. Evidence: headline values and deltas versus baseline are presented below in a compact table for quick decision-making. Explanation: these metrics were chosen to reflect operational priorities for deployment: bandwidth efficiency, predictable latency, power economy, and field reliability. Actionable note: use the table to map required SLAs to acceptable configuration and cooling options.
| Metric | P230-001 (headline) | Delta vs. baseline |
|---|---|---|
| Sustained throughput | 1.20 Gbps | +8.5% |
| 95th pct latency | 6.8 ms | -14% |
| Idle power / Load power | 2.3 W / 49 W | Idle -10%, Load -4% |
| MTBF (accelerated) | 220,000 hours (est.) | +18% |
2.2 — Performance trade-offs & limiting factors
Point: Tests reveal trade-offs between peak throughput and power envelope; thermal throttling emerges under sustained peak loads without forced-air cooling. Evidence: throughput curves flatten above 85% CPU utilization while power increases nonlinearly, and latency variance widens with rising junction temperature. Explanation: bottlenecks are primarily the power delivery headroom and clock stability at high ambient temperatures; workload burstiness exacerbates thermal response. Actionable note: prioritize cooling or configure conservative power caps for latency-sensitive deployments.
3 — Detailed Technical Specs & Component-Level Analysis
3.1 — Electrical, mechanical and thermal specifications (specs)
Point: Key specs are summarized for integration and procurement: input voltage, steady-state current draw, dimensions, weight, thermal dissipation, and MTBF. Evidence: measurements used bench power analyzers (1% accuracy), thermal imaging, and accelerated stress setups; mechanical dimensions follow standard mounting footprints. Explanation: the spec table below aligns with common datasheet formats and includes measurement method notes for reproducibility. Actionable note: confirm chassis clearances and verify your site's ambient temperature against the device thermal limits before ordering.
| Parameter | Value | Measurement / Notes |
|---|---|---|
| Input voltage | 12 V ±5% | Bench supply, tolerance measured at connectors |
| Idle / Max current | 0.19 A / 4.1 A | Measured with power analyzer, averaged over 60s |
| Power envelope (typ./peak) | 2.3 W / 49 W | Measured with synthetic peak workload |
| Dimensions | 95 × 72 × 18 mm | CNC-caliper verified |
| MTBF (est.) | 220,000 hours | Derived from accelerated stress (HTOL) statistical model |
| Thermal dissipation | Max junction 95°C under 50 W with passive cooling | Infrared mapping and thermocouples |
3.2 — Component-level behavior and tolerances
Point: Critical components include the primary power regulator, the system clock oscillator, and front-end I/O transceivers; each contributes to system margins and repeatability. Evidence: regulator ripple and transient response were measured; clock jitter measured at 10 ps RMS under nominal load; I/O BER tested to 1e-12 over 24-hour runs. Explanation: observed tolerances suggest a 15% margin on power rails and 10 ppm margin on timing-critical interfaces for safe integration. Actionable note: specify power-supply derating and include a phase-locked loop margin in designs where timing is critical.
4 — Test Methodology & Benchmark Procedures
4.1 — Test design, instrumentation & data collection
Point: Tests used reproducible rigs: calibrated power analyzer (1% accuracy), network traffic generator (packet timing accuracy ±1 µs), and environmental chamber for temperature sweeps. Evidence: sampling rates were 1 kHz for power, 10 kHz for thermal sensors, and logs retained in CSV with UTC timestamps. Explanation: repeatability was assessed by 10-run sequences; reported confidence intervals are 95% CI with n≥10 for steady-state metrics. Actionable note: when replicating, use identical sampling and calibration routines and include full CSV logs for verification.
4.2 — Benchmark procedures, workloads & pass/fail criteria
Point: Benchmarks combined synthetic and real-world loads to stress specific subsystems: continuous throughput, bursty small-packet latency, and mixed CPU+I/O. Evidence: each procedure lists steps, duration, and acceptance thresholds; pass/fail criteria defined by throughput floor, 95th percentile latency ceiling, and thermal limits. Explanation: reproducibility depends on baseline host config and firmware lock. Actionable note: follow the ordered steps below to reproduce each benchmark.
- Restore reference firmware and boot to idle; verify baseline voltages.
- Run 30-minute steady throughput at target link rate; record power and latency.
- Execute 10 bursts of small-packet load; measure 95th percentile latency and jitter.
- Perform HTOL stress for 72 hours for early reliability indicators.
- Compare results to pass/fail thresholds: throughput ≥ 90% of rated, 95th pct latency ≤ 10 ms, junction ≤ 95°C.
5 — Comparative Use Cases, Integration Notes & Recommendations
5.1 — Representative deployment scenarios and comparative analysis
Point: Two representative scenarios—edge telemetry aggregator and local analytics node—illustrate operational behavior and trade-offs. Evidence: in telemetry aggregation (constant small packets), P230-001 sustained 1.0 Gbps with 7.1 ms 95th pct latency; in analytics (bursty CPU), throughput peaked but latency variability rose under thermal stress. Explanation: comparative analysis versus industry baselines shows improved power efficiency but similar peak throughput. Actionable note: choose deployment type and cooling strategy according to the scenario metrics below.
| Scenario | Key metric | Observed |
|---|---|---|
| Telemetry aggregator | 95th pct latency | 7.1 ms |
| Local analytics | Peak throughput | 1.25 Gbps (thermal limit) |
5.2 — Integration checklist & actionable recommendations
Point: Prioritized integration steps reduce risk and optimize performance. Evidence: derived from test failures and successful runs; checklist below captures necessary pre-deployment validations. Explanation: following these items will minimize field surprises related to power, thermal, and firmware mismatches. Actionable note: execute checklist items in order and document results in the procurement record.
- Validate host power rail tolerance and derate to 85% of measured max draw.
- Confirm chassis airflow provides at least 10 LFM across hottest component area.
- Lock firmware to validated version and record checksum in deployment ticket.
- Set conservative power-cap profiles for latency-sensitive services.
- Schedule preventative maintenance every 12 months for connectors and cooling paths.
Summary (conclusion & next steps)
Conclusion: P230-001 delivers an efficient balance of throughput, latency, and power for edge and industrial use, with measured MTBF and clear thermal sensitivities that are manageable with modest integration controls. Recommendation: proceed to a targeted pilot deployment to validate behavior in the intended environment and to collect field telemetry for long-term reliability modeling; include the P230-001 in initial procurement shortlists where power efficiency is a priority.
- P230-001 delivers ~1.2 Gbps sustained throughput with improved power efficiency; confirm cooling margin during procurement.
- Measured 95th percentile latency (~6.8 ms) supports latency-sensitive aggregation if thermal controls are applied.
- Spec table and component tolerances indicate requiring a 15% power-supply margin and firmware lock for reproducibility in deployments.
Frequently Asked Questions
What are the primary P230-001 performance metrics to evaluate?
Primary metrics are sustained throughput, 95th percentile latency, power draw at idle and peak, and MTBF under accelerated stress tests. Evaluate these against your service-level objectives and site power/cooling constraints; reproduce tests on representative host hardware to confirm compatibility before procurement.
How were the P230-001 specs measured and validated?
Specifications were measured using calibrated power analyzers, network traffic generators, thermocouples, and infrared mapping; sampling rates and logging were standardized, and repeatability was assessed with n≥10 runs producing 95% confidence intervals. Use identical instrumentation and record raw CSVs when reproducing results.
What integration steps minimize thermal and power risks for P230-001?
Key steps: derate power supplies by 15%, ensure at least 10 LFM airflow across hot components, set conservative power caps for latency-critical workloads, lock firmware to validated builds, and schedule periodic inspections. These steps reduce the chance of thermal throttling and unexpected field failures.
What are the target use cases and applications for the P230-001 module?
The P230-001 is designed for edge compute and industrial I/O aggregation. Target applications include telemetry aggregation, protocol bridging, and local edge analytics where deterministic latency and sub-5W idle power envelopes are required.


